
|
Supplement No. 17May 16, 2020 A Need to Change the Direction of the Economy |

| Protecting Health and Safety | |
| COVID-19 Response Fund | $1.1 billion |
| Funding for PPE | $2.0 billion |
| Direct Support Measures | |
| Canada Emergency Response Benefit (will increase due to expansion of eligibility criteria) | $24.0 billion+ |
| Enhanced GST credit | $5.5 billion |
| Enhanced Canada Child Benefit | $1.9 billion |
| Temporary Business Wage Subsidy | $975 million |
| Canada Emergency Wage Subsidy | $73.0 billion |
| Canada Student Loan Payments | $190 million |
| Support for Indigenous Communities | $305 million |
| Support for the Homeless (through the existing Reaching Home program) | $157.5 million |
| Support for Women’s Shelters and Sexual Assault Centres | $50 million |
| Support for Seniors, Children and Youth | $16.5 million |
| Support for food banks and local food organizations | $100 million |
| Lower RRIF minimum withdrawal | $495 million |
| Support for air transportation sector | $331.4 million |
| For employers to support quarantine measures for temporary foreign workers (April 13) | $50 million |
| For northern communities (April 14) | $130 million |
| For the Canadian Food Inspection Agency (April 14) | $20 million |
| To clean up oil wells in Alberta, BC, Saskatchewan (April 17) | $1.7 billion |
| Emission reduction fund (April 17) | $750 million |
| For Indigenous businesses (April 18) | $306 million+ |
| Emergency Fund for Community Support (April 21) (community organizations and non-profit organizations) | $350 million |
| Support for post-secondary students (April 22) | $9.0 billion |
| National medical/research strategy (April 23) | $1.1 billion |
| Support for Fish and Seafood processors (April 24) | $62.5 million |
| Canada Emergency Commercial Rent Assistance (April 24) | $2.0 billion |
| For Food Processors (May 5) | $252 million |
| For top-up of wages for essential workers (May 7) (administered by provinces who will contribute $1 billion) | $3.0 billion |
| New measures to support seniors (May 12) | $2.5 billion |
| New Horizons for Seniors Program expansion | $20 million |
| Liquidity Support to Businesses and Individuals | |
| Income tax payment deferral to September | $55 billion |
| Sales tax remittance and Customs Duty payment deferral | $30 billion |
| Regional Relief and Recovery Fund (RRRF) (May 13) | $962 million |
| Business Credit Availability Program (through the Business Development Bank of Canada (BDC) and Export Development Canada (EDC)) | |
| Small and medium-sized Enterprise Loan and guarantee program | $40 billion |
| Canada Emergency Business Account | $25 billion |
| Credit and liquidity support for the Agricultural Sector | $5.2 billion |
| Credit and liquidity support (through the Bank of Canada, OSFI, CMHC and commercial lenders) | $500 billion+ |
Altogether, these federal programs total over $787.522 billion. Many of these announcements have been accompanied by statements that these are initial amounts (e.g., seafood and agriculture), that there will be more funding to come, or that changes could be expected to time lines and eligibility criteria, etc., which will increase the amounts. On May 11, the Prime Minister announced that a Large Employer Emergency Financing Facility (LEEFF) will be established "to provide bridge financing to Canada's largest employers, whose needs during the pandemic are not being met through conventional financing, in order to keep their operations going." No amount for this program was provided. The BCAP is to be expanded "to mid-sized companies with larger financing needs." There have also been promises of more support to come for specific sectors, including tourism and energy.
In addition to funds announced by the federal government, provincial and territorial governments have implemented various programs. Programs for which a cost has been identified total over $28 billion. But there are many more for which no dollar figure has been given, including delays in income tax filing deadlines, forgiveness of student loans, direct subsidies to day cares and community organizations, such as food banks, wage subsidies for workers ineligible for federal programs or to add to federal programs, credit for small businesses, rental assistance and financial assistance for people on social assistance.
(Department of Finance, Press statements of Ministers, McCarthy Tétrault "COVID-19: Economic relief measures announced to date.")

Statistics Canada Labour Force Survey, April 2020 (Excerpts)
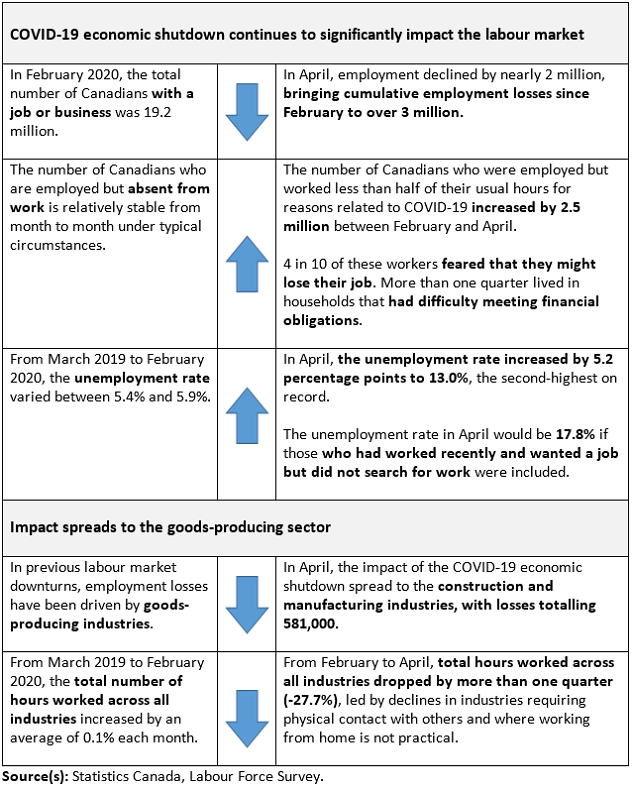
Following a drop of over one million in March, employment fell by nearly two million in April, bringing the total employment decline since the beginning of the COVID-19 economic shutdown to over three million.
In addition, the number of people who were employed but worked less than half of their usual hours for reasons related to COVID-19 increased by 2.5 million from February to April. As of the week of April 12, the cumulative effect of the COVID-19 economic shutdown -- the number of Canadians who were either not employed or working substantially reduced hours -- was 5.5 million, or more than one-quarter of February's employment level.
In April, both full-time (-1,472,000; -9.7%) and part-time (-522,000; -17.1%) employment fell. Cumulative losses since February totalled 1,946,000 (-12.5%) in full-time work and 1,059,000 (-29.6%) in part-time employment.
Drop in Employment Is Unprecedented
The magnitude of the decline in employment since February (-15.7%) far exceeds declines observed in previous labour market downturns. For example, the 1981-1982 recession resulted in a total employment decline of 612,000 (-5.4%) over approximately 17 months.
Large Increase in Unemployment
The unemployment rate rose 5.2 percentage points in April to 13.0%. This followed an increase of 2.2 percentage points in March. Over the period since comparable data became available in 1976, the April unemployment rate was second only to the 13.1% observed in December 1982.
The April unemployment rate would be 17.8%, when adjusted to reflect those who were not counted as unemployed for reasons specific to the COVID-19 economic shutdown. During the week of April 12, 1.1 million people were not in the labour force but had worked recently (in March or April) and wanted to work. They were not counted as unemployed but were counted as not in the labour force because they did not look for work, presumably due to ongoing business closures and very limited opportunities to find new work.
Infographic 1
Infographic 2
Infographic 4
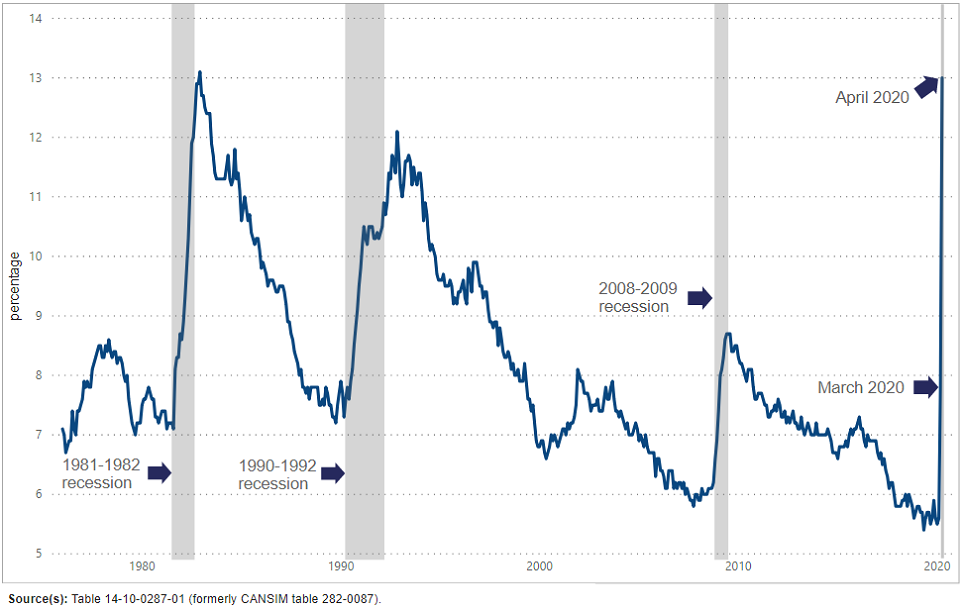
Unemployment rate increases during economic downturns, Canada, 1976 to 2020
Increase in Unemployment Driven by Temporary Layoffs
Total unemployment grew by 1,285,000 (+113.3%) from February to April. By comparison, during the 1981-1982 recession unemployment rose by 763,000 (+88.6%) over the course of 16 months. In April, almost all (97.0%) of the newly-unemployed were on temporary layoff (not seasonally adjusted), indicating that they expected to return to their former employer as the shutdown is relaxed.
In any given month, the net change in unemployment is the result of the difference between the number of people becoming unemployed and those leaving unemployment. Since the start of the COVID-19 economic shutdown, inflows into unemployment have been increasing sharply, due largely to a rise in the number of people moving from employment to unemployment (+1.1 million since February).
In April, outflows from unemployment also grew as the number of people moving from unemployment to being out of the labour force increased (+214,000). This includes people who wanted a job but stopped looking for one -- including those who did not think that work was available—-and those who assumed new pursuits, such as caring for family members.
All Provinces Have Been Hard-Hit
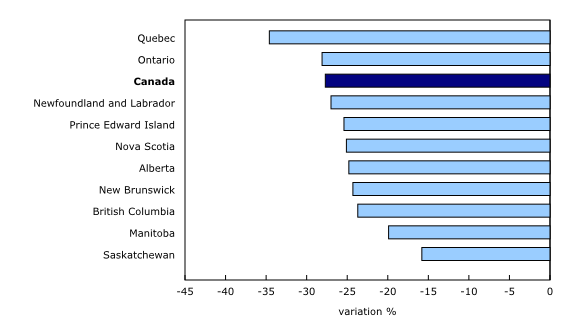
Employment declined in all provinces for the second month in a row. Compared with February, employment declined by more than 10% in all provinces, led by Quebec (-18.7% or -821,000).
Chart 1
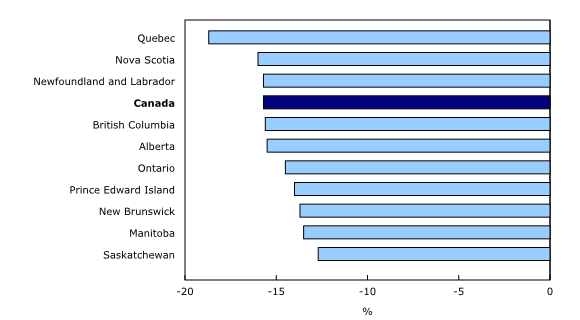
Employment change by province, February to April 2020
The unemployment rate rose markedly in all provinces in April. In Quebec, the rate rose to 17.0%, the highest rate in the province since comparable data became available in 1976, and the highest among all provinces. The number of unemployed people increased at a faster pace in Quebec (+101.0% or +367,000) than in other provinces. In April, the increase in the number of people on temporary layoff (not seasonally adjusted) was proportionately higher in Quebec than in other provinces, while the increase in the number of people out of the labour force was proportionately lower.
Canada's Largest Cities Face Large COVID-19
Labour Market Impacts
Employment dropped sharply from February to April in each of Canada's three largest census metropolitan areas (CMAs). As a proportion of February employment, Montréal recorded the largest decline (-18.0%; -404,000), followed by Vancouver (-17.4%; -256,000) and Toronto (-15.2%; -539,000).
In the CMA of Montréal, the unemployment rate was 18.2% in April, an increase of 13.4 percentage points since February. In comparison, the unemployment rate in Montréal peaked at 10.2% during the 2008/2009 recession. In Toronto, the unemployment rate was 11.1% in April (up 5.6 percentage points since February) and in Vancouver it was 10.8% (up 6.2 percentage points).
Number of Solo Self-Employed Little
Changed,
but Large Drop in Hours Worked
but Large Drop in Hours Worked
The number of solo self-employed workers (2.0 million) -- that is, those with no employees -- was little changed in April compared with February (not adjusted for seasonality). For this group of workers, the impact of the COVID-19 shutdown has been felt through a significant loss of hours worked. In April, 59.4% of the solo self-employed (1.2 million) worked less than half of their usual hours during the week of April 12, including 38.4% who did not work any hours.
[...]
Most of Those Who Were Absent from Work Were Not Paid
During the reference week of April 12 to 18, 2.4 million people were employed but absent for the full week. This was an increase of 2.1 million compared with February, with the increase being attributable to the COVID-19 economic shutdown. The number of people who worked some hours, but less than half of their usual hours, increased by 380,000, bringing the total increase in absences since February attributable to COVID-19 to 2.5 million.
About 60% of those who were absent for the entire reference week were employees, while the remainder were self-employed. Among employees, about three in four were not paid for the reference week, an increase since March, when 55.8% were not paid. Less than 1 in 10 self-employed workers who had an incorporated business received pay.
Summary: More than One-Third of the
Potential Labour Force Underutilized in April
In April, more than one-third (36.7%) of the potential labour force did not work or worked less than half of their usual hours, illustrating the continuing impact of the COVID-19 economic shutdown on the labour market. The "recent labour underutilization rate" combines those who were unemployed; those who were not in the labour force, who wanted a job, but did not look for one; and those who were employed but worked less than half of their usual hours. In comparison, this rate was 11.3% in February.
Impact of COVID-19 Economic Shutdown Spreads to the Goods-Producing Sector
Employment losses in goods-producing sector
In March, almost all employment losses were observed in the services-producing sector. In April, by contrast, employment losses were proportionally larger in goods (-15.8%; -621,000) than in services (-9.6%; -1.4 million). Losses in the goods-producing sector were led by construction (-314,000; -21.1%) and manufacturing (-267,000; -15.7%).
Within the services sector, employment losses continued in several industries, led by wholesale and retail trade (-375,000; -14.0%) and accommodation and food services (-321,000; -34.3%).
Industries which continued to be relatively less affected by the COVID-19 economic shutdown included utilities; public administration; and finance, insurance and real estate.
Chart 2
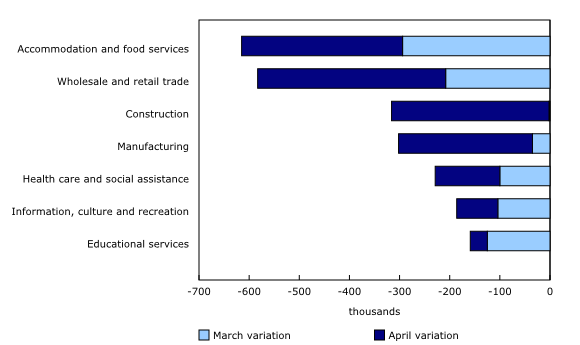
Employment variation from February to April 2020, Canada, selected sectors
[...]
Employment Decreases in both Goods and Services
Surpass
Previous Labour Market Downturns
In both the services-producing and the goods-producing sectors, the employment decreases observed in the two months since February were proportionally larger than the losses observed during each of the three significant labour market downturns since 1980.
[...]
After the previous downturns, employment in services recovered relatively quickly, returning to pre-downturn levels in an average of four months. On the other hand, it took an average of more than six years for goods-producing employment to return to pre-recession levels following the 1981-1982 and 1990-1992 recessions. After the 2008-2009 global financial crisis, it took 10 years for employment in the goods-producing sector to return to pre-crisis levels.
Chart 3

Larger employment declines since February 2020
than during any of the last
three notable recessions
Employment Losses Spread to Construction and Manufacturing
Employment in the construction sector declined by 314,000 or 21.1% in April, after being virtually unchanged in March. Construction in Quebec was particularly impacted, with employment in the sector declining by 38.6% in April. The Quebec provincial government directed all construction worksites to close on March 23, after the March LFS reference week, before allowing some of the residential construction sites to reopen on April 20, after the end of the April reference week.
Compared with February, employment in manufacturing decreased by 302,000 or 17.3% with almost all of the decline happening in April. Employment in transportation equipment, machinery and fabricated metal products decreased the most since February, hinting at bottlenecks in the supply chain and lower demand for some products. At the same time, employment in food manufacturing was relatively stable.
Employment in accommodation and food services declined by 50.0% (-615,000) from February to April. Employment in occupations such as food and beverage services, as well as kitchen staff, decreased the most. The number of managers declined to a lesser degree. The number of hours worked in accommodation and food services in April declined a further 38.6% after having declined in March. Since February, the number of hours worked in the sector decreased by 63.8%.
Employment in wholesale and retail trade fell by 582,000 or 20.2% in the two months to April. The number of hours worked declined by 31.0% over the same period. Employment in subsectors related to food and beverages has decreased since February, but proportionally less than in subsectors that were not deemed to be essential services.
Despite the considerable challenges facing health care workers on the front lines of treating COVID-19 patients, employment has remained stable in hospitals and nursing and residential care facilities since February. However, declines have been observed in other health care sectors, including ambulatory care, which includes offices of physicians and dentists as well as medical and diagnostic laboratories. Substantial declines have also been observed in social assistance, which includes day care facilities, bringing net employment declines in the health care and social assistance industry grouping to 129,000 (-5.3%) since March and 229,000 (-9.1%) since February.
In March and April, domestic and international demand for oil dropped significantly, resulting in record-low prices. As of the week of April 12, employment in the capital-intensive oil and gas industry had proven to be resilient to these price shocks. Impacts may be observed in the coming months. Since February, employment in the broader natural resources sector has declined 7.4%, with mining and quarrying responsible for the largest variation in both employment and hours worked.
Small Businesses Facing Significant COVID-19 Impacts
Larger firms and institutions seem to have been more able than smaller businesses to retain employees on payroll, likely due to their capacity to put measures in place to adjust to the COVID-19 economic shutdown. This pattern was observed across industries, including wholesale and retail trade; construction; manufacturing; and transportation and warehousing.
Overall, employment in firms of 100 employees or more declined by 12.6% (not adjusted for seasonality) from February to April. Employment in firms of between 20 and 99 employees declined by 25.1%, while in the smallest firms (less than 20 employees), it declined by 30.8%.
Continued Impact on Total Hours Worked
Overall, the total number of hours worked decreased by 14.9% in April compared with March, and by 27.7% compared with February.
Chart 4
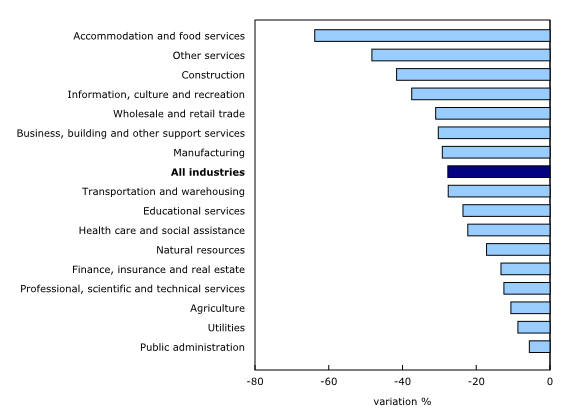
Hours worked variation (%), by industry, Canada, February to April 2020, seasonally adjusted
Chart 5
Hours worked variation (%), by province, February to April 2020, seasonally adjusted
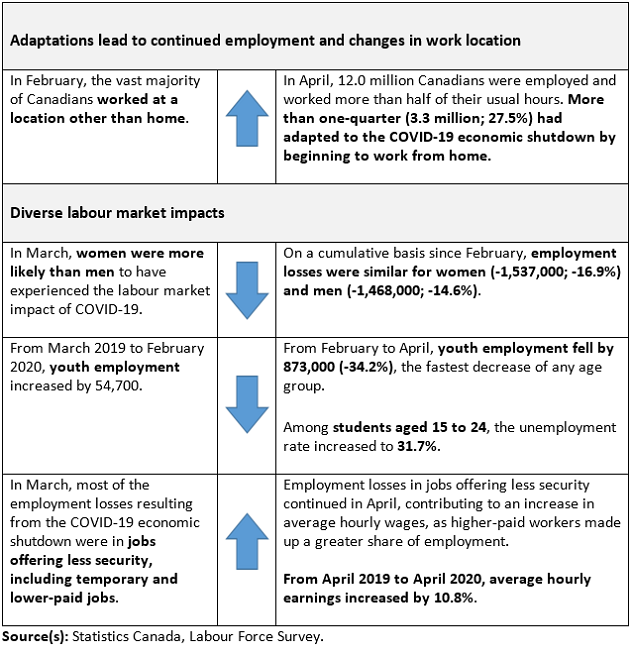
An Additional 3.3 Million Canadians Worked from Home in April
During the week of April 12, 12.0 million Canadians were employed and worked more than 50% of their usual hours. An estimated 5.0 million of these worked most of their hours from home. This included 3.3 million workers who usually worked at a location other than home. It can be reasonably assumed that these workers changed their workplace in response to the COVID-19 economic shutdown.
This ability to adapt in the short term was not balanced across the economy, however. Working from home varied widely by industry in April, reflecting a number of factors, including occupation-related requirements to come into close physical contact with others such as co-workers, clients and the public.
In most industries where such close contact is required, a relatively low proportion of workers who worked at least one hour did their jobs from home. This included accommodation and food services (8.4%), construction (19.0%) and wholesale and retail trade (20.8%). These same industries have experienced some of the largest employment declines since February.
In contrast, in industries where close contact with others is less necessary, more workers tended to do their job from home in April. This includes workers in professional, scientific, and technical services (75.5%); finance, insurance and real estate (67.4%); and public administration (62.6%). These same industries have experienced relatively fewer employment losses since February and may find it easier to resume full activity, either through continuing work from home or possibly through investments in workplace adaptations.
Infographic 6
 Employment losses have been greater
in industries where close physical contact is
required and where working from home is less
common. Click to enlarge
Employment losses have been greater
in industries where close physical contact is
required and where working from home is less
common. Click to enlarge
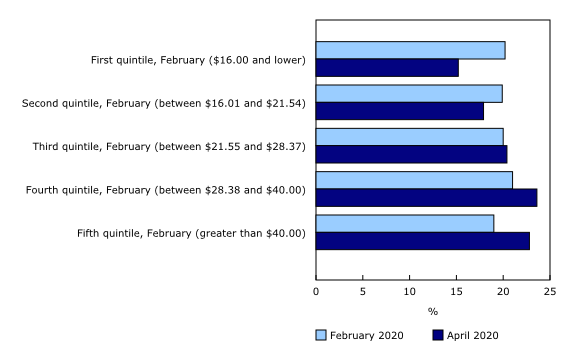
Vulnerable Workers Continue to See Greatest Losses
In April, employment losses continued to be more rapid in jobs offering less security, including temporary and non-unionized jobs.
In the two months since February, employment (not adjusted for seasonality) declined by 17.8% among all paid employees. The pace of employment losses was above-average among employees with a temporary job (-30.2%), those with job tenure of one year or less (-29.5%) and those not covered by a union or collective agreement (-21.2%). There were also sharper declines for employees earning less than two-thirds of the 2019 median hourly wage of $24.04 (-38.1%) and those who are paid by the hour (-25.1%).
This is consistent with the declines observed in accommodation and food services, and wholesale and retail trade, which generally have a higher proportion of workers with these characteristics. Despite these declines, there were approximately one million people in low-wage, non-unionized, hourly-paid jobs in April who worked at least some hours during the reference week. Of these, 89.1% worked at locations outside the home. Two-thirds of those working in locations outside the home were employed in accommodation and food services or wholesale and retail trade—-both industries with relatively high proportions of workers in jobs usually requiring close physical contact.
Chart 6
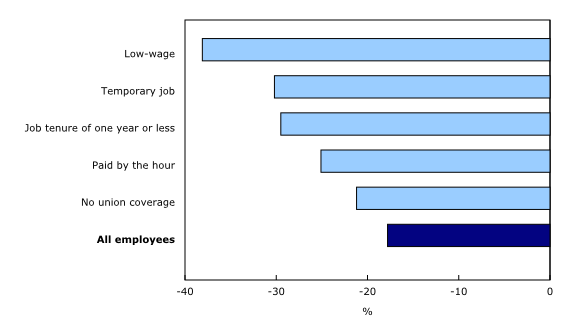
Employment change among paid employees by employment characteristic, Canada, February to April 2020, not adjusted for seasonality
Increase in Average Wages as Lower-Paid Jobs Disappear
Compared with one year earlier, average hourly wages rose 10.8% in April, mainly as a result of a 7.3% increase occurring from February to April. This increase was attributable in part to larger employment declines in relatively low-paying industries, which has had the result of raising average wages.
Since February, more than half of the employment decrease observed in the services-producing sector has been in accommodation and food services and in wholesale and retail trade, two of the lowest-paying industries. At the same time, relatively more people remained employed in industries where work can be done from home, such as public administration and professional, scientific and technical services, two of the highest-paying industries.
Chart 7
Hourly wage distribution shifting as a result of larger employment declines in relatively low-paying industries, Canada, February to April 2020
More People Living in Families Where No One Is Employed
In the two months since February, the number of people aged 15 and older living in economic families (which includes people living alone) where no one is employed has increased by 23.5% (+1,655,000) (not adjusted for seasonality).
The number of people living in couples in which only one partner is employed increased by 27.3% (+1,134,000), while the number living in couples where neither partner is employed increased by 22.5% (+845,000). The number of single parents who are not employed increased by 53.9% (+126,000) (not adjusted for seasonality).
Just Over One in Five Canadians Live in
Households Reporting
Difficulty Meeting Financial Obligations
The relative concentration of COVID-related employment losses among less secure jobs raises important questions about the financial capacity of Canadians to adapt to the economic shutdown. To shed light on these challenges, a question on the ability of households to make basic payments such as rent, mortgage and groceries was added to the April LFS.
During the week of April 12, just over one in five Canadians (21.1%) lived in a household reporting difficulty meeting immediate financial obligations. In 2018, this same question was posed in the Canadian Housing Survey and results were similar.
Although the overall proportion of Canadians facing immediate financial hardship has remained relatively stable, the April LFS sheds light on groups of workers where financial difficulties are most common. Nearly one-third (32.1%) of unemployed people aged 15 to 69 lived in a household reporting difficulties, compared with 21.9% of those not in the labour force and 17.5% of those who were employed. Among the employed, the share living in households reporting difficulties was higher for those who worked less than half of their usual hours (26.1%), compared with those who were at work for most or all of the reference week (15.3%).
An Initial Profile of Applicants to Economic Benefit Programs
Employment and Social Development Canada has announced that, as of April 19, the first day of April LFS interviews, 6.7 million Canadians had applied for either EI or CERB benefits since March 15.
Based on LFS results, about 6 in 10 (59.6%) of those who had applied for either CERB or regular EI benefits since March 15 were in the core-working age group of 25 to 54. About 1 in 5 applicants (19.7%) were youth aged 15 to 24. Applicants were equally likely to be women (50.8%) or men (49.2%).
Among those aged 15 to 69 who lived in a household reporting difficulty meeting financial obligations, 21.4% indicated that they had applied for either CERB or EI benefits since March 15. This compares to 9.8% of those who lived in a household that reported it was easy to meet financial obligations.
Employment Declines the Fastest Among Youth
COVID-19 has disproportionally affected Canada's youth (aged 15 to 24). As a group, they are more likely to hold less secure jobs in hard-hit industries such as accommodation and food services. From February to April, employment among youth declined by 873,000 (-34.2%), while an additional 385,000 (or one in four) who remained employed in April lost all or the majority of their usual hours worked (not adjusted for seasonality). Employment declined faster among those aged 15 to 19 (-40.4%) than among those aged 20 to 24 (-31.1%), reflecting the less secure jobs held by those in the younger age category.
Among students aged 15 to 24 in April, the unemployment rate increased to 31.7% (not adjusted for seasonality), signalling that many could face difficulties in continuing to pay for their studies. Among non-student youth, a little more than half were employed in April, down from three-quarters in February (data not seasonally adjusted).
Employment Losses More Evenly Split Between Men
and Women in April
While women accounted for a disproportionate share of job losses in March, declines in April were larger among men, resulting in a narrowing of the gender gap in cumulative employment losses. Among the total population aged 15 and older, employment losses from February to April totalled 1,537,000 (-16.9%) for women and 1,468,000 (-14.6%) for men.
For core-aged women, employment fell by 790,000 (-13.2%) from February to April, while a further 1,057,000 (20.3%) remained employed in April but lost all or the majority of their usual hours worked (not adjusted for seasonality). The numbers were similar for core-aged men, with employment declining by 773,000 (-12.0%), and an additional 1,049,000 (18.6%) losing all or the majority of their usual hours (not adjusted for seasonality).
While core-aged men and women had somewhat comparable overall employment losses, nearly all (92.9%) of the employment decline for core-aged men from February to April was among full-time workers, compared with 69.9% for women. This, combined with the different industries in which men and women have lost their jobs -- for example, more job losses among men have been in construction, and fewer have been in retail trade -- signals that the challenges associated with recovering from the COVID-19 economic shutdown may be different for women and men.
Chart 8

Employment change by age group and sex, Canada, February to April 2020
Very Recent Immigrants Hit Harder by Labour
Market
Impacts of COVID-19
Employment among very recent immigrants (five years or less) fell more sharply from February to April (-23.2%) than it did for those born in Canada (-14.0%). This is partly because this group is more likely than people born in Canada to work in industries which have been particularly affected by the COVID-19 economic shutdown, such as accommodation and food services, and less likely to work in less severely-impacted industries, such as public administration.
Employment among the total landed immigrant population declined by 18.0% from February to April (not adjusted for seasonality), as established immigrants (10 years or more) (-17.0%) and recent immigrants (more than 5 but less than 10 years) (-17.4%) fared better than their very recently-arrived counterparts.
Few Differences Observed Between
Indigenous and
Non-Indigenous Canadians
Non-Indigenous Canadians
Compared with February, employment losses in April among the off-reserve Aboriginal population (-16.2%) were comparable to those in the non-Aboriginal population (-15.3%) (not adjusted for seasonality). In 2019, the employment rate for the off-reserve Aboriginal population was 57.5%, compared with 62.1% for the non-Aboriginal population. This disparity could affect the ability of these groups to recover from the COVID-19 economic shutdown.
[...]
Ongoing Job Attachment May Ease Economic Recovery
In April, there were approximately 5.8 million people who did not work and who could reasonably be expected to return to work when public health and economic conditions allow (not seasonally adjusted). Of these, about two-thirds (3.8 million) had some type of attachment to a specific job, that is, they were employed but worked no hours for reasons related to COVID-19, or they had been temporarily laid off, suggesting that they expected to return to the same job within six months.
Approximately one-third (2.0 million) had no connection to a current or recent job. This includes those who were unemployed for reasons other than temporary layoff and those who left the labour force in March or April and reported that they wanted a job. The proportion of people who did not have a connection to a current or recent job was higher among youth aged 15 to 24 (44.6%) than among their core-aged (32.7%) and older (27.3%) counterparts. Men (35.2%) were slightly more likely than women (32.7%) to be in this situation.
For full survey click here.
Pandemic to Spill Red Ink All over Provinces' Books
The COVID-19 pandemic is setting provincial government deficits on course to surge more than six-fold this year to almost $63 billion.
Every province will see a material deterioration in its fiscal position.... We generally do not foresee any major problems with the financing of heftier deficits in the near term. If anything, liquidity support from the Bank of Canada will ensure funding channels stay open and funding costs remain manageable.
[It must be noted that RBC is one of the institutions of the financial oligarchy that will benefit greatly from government borrowing. RBC not only lends money to governments throughout the imperialist system of states but also profits from organizing sales of government securities. TML Ed.]
The federal government's programs to directly support individuals and businesses in need total more than $230 billion (10 per cent of GDP).
Provinces handling of the health emergency and rollout of their own financial support programs will run in the billions of dollars too. British Columbia ($5 billion), Alberta ($7.7 billion), Ontario ($17 billion) and Quebec ($18 billion), for example, put forward historic action plans. Clearly governments are seeing enormous spending pressures that will take a heavy toll on their fiscal position.
[RBC estimates the total federal and provincial spending on financial support programs to be $315 billion and growing. To put this in perspective, total expenses in the 2018-19 federal budget were $347 billion. TML Ed.]
Recession Delivers a Massive Blow to Government Revenue
Yet the expenditure toll could pale in comparison to the shock that's pummeling government revenues. The COVID-19 pandemic has triggered the most sudden and deepest recession we've ever seen. All but two provinces (British Columbia, and Newfoundland and Labrador) will experience their largest-ever single-year economic contraction, according to RBC Economics' latest Provincial Outlook update (see excerpts below).
This will ravage household and business incomes, and severely affect governments' major revenue sources. We expect personal and corporate income taxes, and sales taxes to fall markedly in every province this year. The revenue decline could be in the order of $3 billion in British Columbia (-6% of own-revenue), $6.3 billion in Ontario (-4.8%) and $8 billion in Quebec (-8.6%) based on historical sensitivity to economic growth.
Oil price collapse: a punch to oil-producing provinces' gut. Newfoundland and Labrador, Alberta and Saskatchewan face even more dramatic declines due to their dependence on oil royalties. We estimate the plunge in oil prices will slash those royalties by at least 40%. That's not even taking into account production cuts that are likely to occur in the face of a glut in global inventories. Including secondary effects on other parts of the economy, the energy sector tailspin could subtract more than $8 billion (or close to 20%) from revenue in Alberta this year.
COVID-19 has completely changed the fiscal outlook for all provinces. There will be deficits everywhere in 2020-2021. Big ones in the case of a couple of oil-producing provinces. We see the shortfall reaching close to $2 billion (7.0% of GDP) in Newfoundland and Labrador, and $18 billion (6.4%) in Alberta or more than double the government's $6.8 billion projection in its February budget. Saskatchewan's lesser reliance on oil royalties will moderate its deficit to around $1.5 billion (2.1% of GDP). Ontario's relatively fresh $20.5 billion deficit projection (dated March 25) looks a little optimistic to us despite nearly $5 billion in contingencies built into the estimate. We believe it could exceed $21 billion (2.5% of GDP) .... We expect deficits of the order of $5 billion in BC (1.8% of GDP), $13 billion in Quebec (3.0%), $600 million in New Brunswick (1.8%) and $800 million in Nova Scotia (1.9%) .... Our $1.5 billion projected shortfall in Manitoba (2.1% of GDP) will completely deplete the province s rainy day fund.
Provincial Debt Will Grow a Lot Faster
Funding the big jump in deficits this year will require a substantial increase in debt issuance. That process is already underway with many provinces tapping the funding market repeatedly since the middle of March. We expect the increase in provincial net debt to more than triple overall this year.
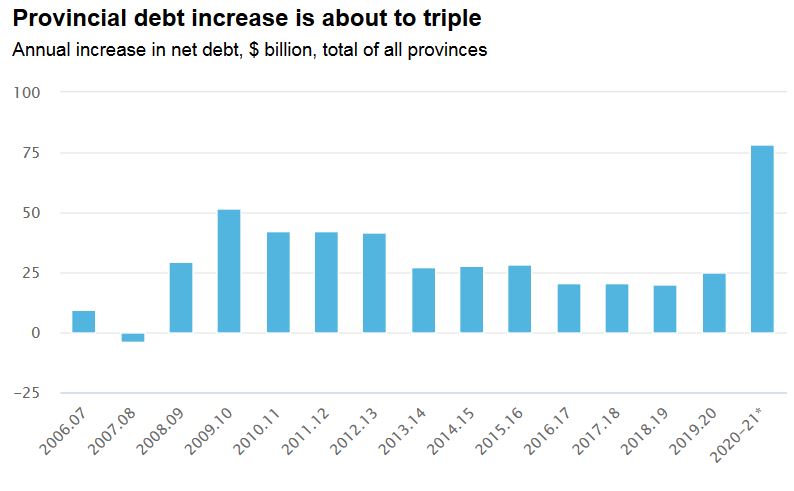
We don't see higher debt loads impeding provincial governments' ability to fulfill their growing borrowing needs in any material way. In a precautionary move, the Bank of Canada recently announced it will purchase up to $50 billion in provincial bonds in the secondary market with remaining maturities of 10 years or less. This will be in addition to the provincial money market purchase program it launched earlier. These moves should ensure liquidity in provincial funding channels. All provinces can presently borrow at historically low interest rates which will help to contain the rise in debt service costs.
COVID-19 Recession Deepens Fast from Coast to
Coast
-- Excerpts from RBC Provincial Report
The mind-blowing 1 million job losses recorded nationwide in March far exceeded anything we've ever experienced. What's more disturbing is this is likely to pale in comparison to the losses that will be reported for April. No region of the country is being spared from the shock. We have downgraded our provincial growth forecast (yet again!) across the board in light of recent developments and dynamics currently at play. We now project all provinces will slip into a severe recession this year....
The economic impact of COVID-19 will be widespread across the country irrespective of the number of cases in each province. This is because social distancing orders are in place everywhere and are directly disrupting big chunks of each provincial economy. Highly impacted industries like retail trade, transportation services (including airlines), education, arts and recreation, and food and accommodation services generally account for roughly one-third of jobs, and 20% to 25% of provincial GDP. Large portions of these industries going offline for a period of a couple of months would easily subtract between 3 and 4 percentage points from growth right off-the-top in most provinces.
Business closures, massive layoffs and drastically reduced working hours for those still employed generate additional knock-on effects for other sectors leading to further job losses and deepening the economic contraction. The end result will be for 2020 to mark the steepest one-year decline in GDP for all provinces except Newfoundland and Labrador and British Columbia. The spike in unemployment in March and April will catapult the jobless rate into double-digits in every single province near term before gradually coming back down over the second half of this year. Alberta, Saskatchewan, and Newfoundland and Labrador won't see single-digit unemployment again until 2021 at the earliest.
The outlook for oil-producing provincial economies is especially grim. The collapse in oil prices already delivered a brutal blow to businesses in the sector. Unfortunately, we expect oil prices to recover only very gradually over the coming year. Facing drastically reduced cash flows, producers are slashing investment and employment, and trimming output. We project employment to plummet by 440,000 in Alberta and 80,000 in Saskatchewan during this crisis. These represent nearly seven times and five times the losses suffered during the 2015-2016 recession, respectively. We see the unemployment rate surging to 20% in the current quarter in Alberta and 15% in Saskatchewan both never-before-seen levels in these provinces....
The extraordinary policy measures put in place by all levels of government (by our count totaling almost $315 billion to date just between the federal government and the larger provinces) and the Bank of Canada over the past many weeks....
While much of the focus has been on federal initiatives, provincial governments have also implemented substantial measures to help individuals and businesses through this crisis. These include direct one-time payments to individuals in self-isolation or whose jobs have been affected by the pandemic, as well as bill and student loan payment deferrals. For businesses, some provincial governments offer emergency aid to help with liquidity ($2.5 billion in Quebec), loan guarantees, as well as deferrals of a range of taxes from education property taxes to sales tax filings. Other provincial measures include direct support to hard hit industries like tourism and hospitality (BC for example is dedicating $1.5 billion to economic recovery efforts). All levels of governments and the central bank have indicated they're prepared to do more if needed.
(To access articles individually click on the black headline.)
Website: www.cpcml.ca Email: editor@cpcml.ca